S
Sebastian Waack
Guest
- Thread Author
- #1
Throughout his Visible Learning journey John Hattie has used the “barometer” to visualize the effect size of an influence on student achievement. It has also also been on the cover of several Visible Learning books. The barometer scale is divided by the hinge point d = 0.4, which represents according to Hattie the mean of all effect sizes in the underlying meta-studies. Hatties “barometer of influence” goes from red (negative effects), to yellow (developmental effects), to green (teacher effects) and finally over the hinge point 0.4 to the blue zone (desired effects).
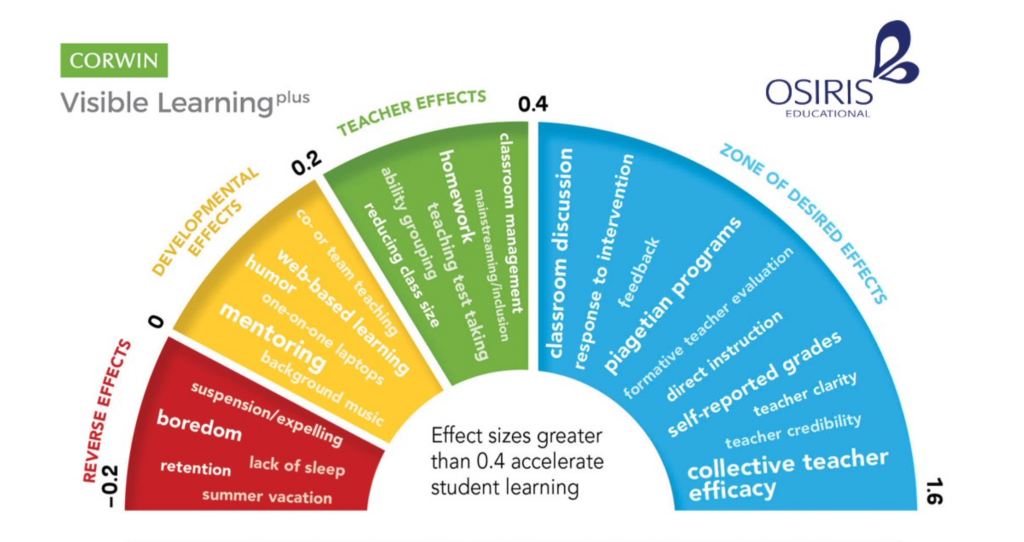
Visible Learning Barometer of Influences. (c) 2019 Corwin and Osiris
The team of Corwin Visible Learning Plus and Osiris Educational have made a nice Infographic available, that is based on this visualization technique and draws data from 250+ influences. You can download and print the PDF at the Osiris Educational Blog.
Source:
(1) Corwin/Osiris: Influences-overview-Visible-Learning.pdfDownload
(2) Corwin/Osiris: 250-Influences.pdfDownload
The post Hattie’s Barometer of influence – Infographic appeared first on VISIBLE LEARNING.